
Case Study
GovTrack
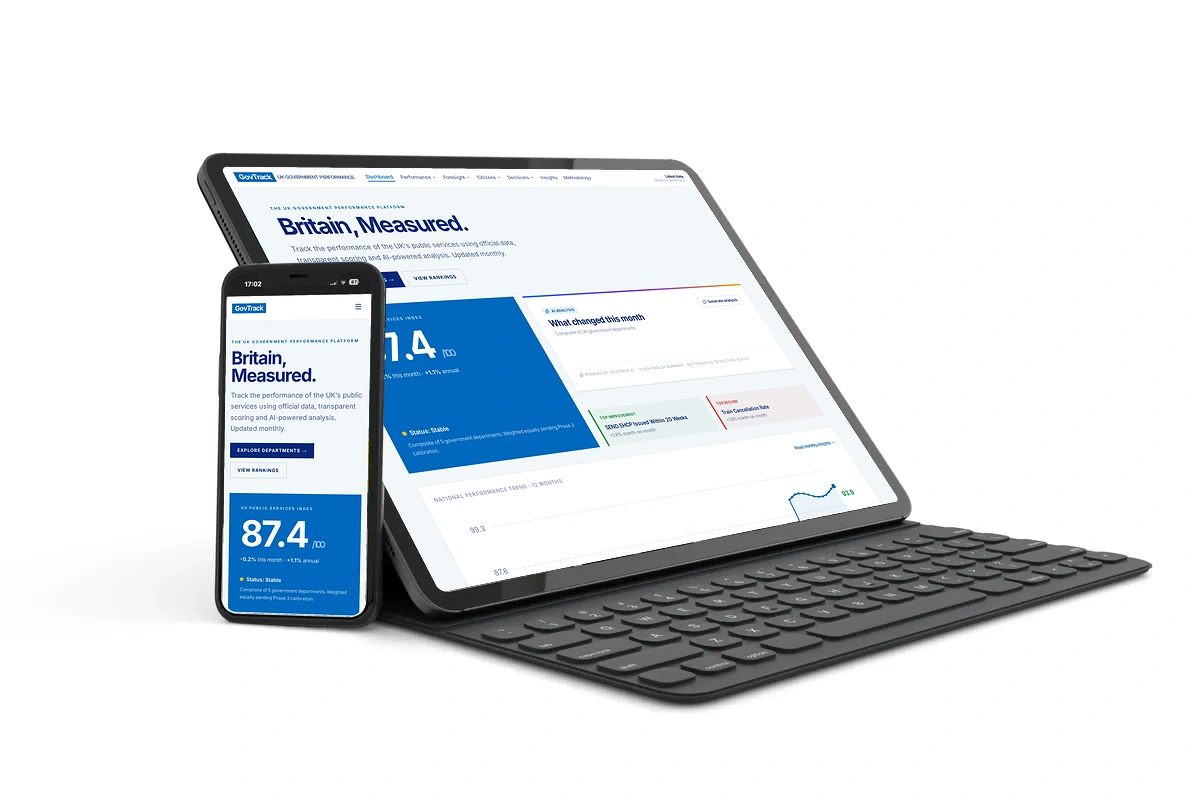
Rise By Digital designed and built GovTrack, a public data platform that tracks the performance of UK public services using official figures, transparent scoring and AI-assisted, plain-English summaries.
Client
GovTrack
Industry
Public Sector Data & Civic Technology
Services
The brief
About GovTrack
GovTrack is a politically neutral platform that helps people see how UK public services are performing. It brings together official government data, scores each measure against its published target and explains what has changed in clear, plain English, starting with the NHS.
Rise By Digital designed and built GovTrack in June 2026, creating the data model, dashboards, AI analysis and website behind the platform.
The Challenge
Make official public service data easy for anyone to understand.
Show at a glance whether public services are improving, stable or declining.
Score very different measures fairly against their published targets.
Explain why performance has changed, without political bias.
Keep every figure traceable back to its official source.
Present complex trends clearly on desktop and mobile.
Keep AI-written summaries accurate and grounded in the numbers.
Build a foundation that can grow from the NHS to more government departments.
Our Solution
Designed and built an interactive dashboard with a headline public services index, a department leaderboard and a long-term trend chart.
Created KPI pages for key NHS measures, including waiting lists, A&E performance, cancer treatment and ambulance response times, each linked to its source.
Built a transparent scoring model that measures each KPI against its target and marks it as improving, stable or declining.
Added AI analysis that writes short, plain-English briefings on what changed, generated from the numerical data alone.
Included an editorial review step so AI summaries are approved before they appear publicly.
Created rankings, department comparisons and highlights of the biggest improvements and declines.
Published a clear methodology and about section so anyone can check how scores are calculated.
Designed a clean, accessible interface that works across desktop and mobile.
Results & Impact
The results
A live public data platform that makes UK public service performance easy to follow.
Clear status signals that show which services are improving and which need attention.
Plain-English AI summaries that explain changes in the data.
Full transparency, with each measure linked back to its official source.
A scoring approach anyone can audit through the published methodology.
Department rankings and comparisons that put performance in context.
A responsive design that presents complex data clearly on any device.
A scalable foundation, ready to expand to more departments and data sets.
Next step
Want results like these? Book an initial discovery call.
Tell us about your business and goals, and our experienced team will show you where we can help.